From DEFRA
Fly-tipping in Hastings
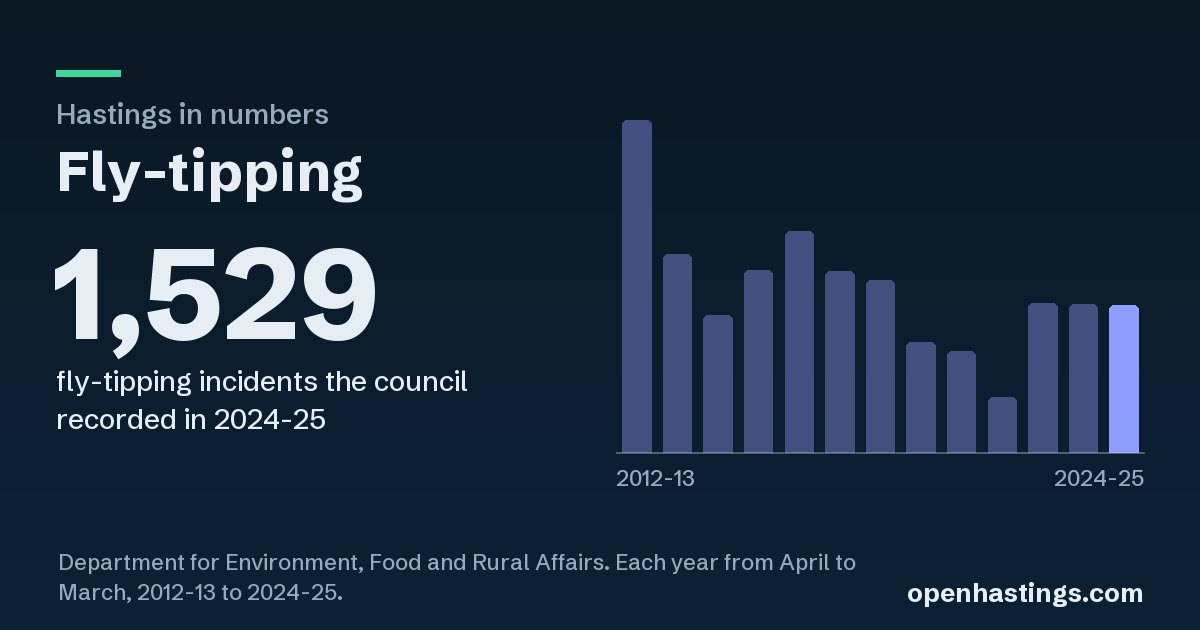
1,529
fly-tipping incidents the council recorded in 2024-25.
The figures as a table
| Year (April to March) | Incidents |
|---|---|
| 2012-13 | 3,464 |
| 2013-14 | 2,063 |
| 2014-15 | 1,434 |
| 2015-16 | 1,899 |
| 2016-17 | 2,306 |
| 2017-18 | 1,886 |
| 2018-19 | 1,791 |
| 2019-20 | 1,147 |
| 2020-21 | 1,055 |
| 2021-22 | 574 |
| 2022-23 | 1,555 |
| 2023-24 | 1,541 |
| 2024-25 | 1,529 |
What it counts
Incidents the borough council recorded and reported to DEFRA, not every fly-tip. A change can be in how incidents are counted as well as in how many there are.
Where it comes from
- From
- Department for Environment, Food and Rural Affairs, Fly-tipping statistics for England
- Period
- Each year from April to March, 2012-13 to 2024-25.
- Licence
- Open Government Licence v3.0.
- Read
- 12 October 2026
Share it
Shared in a chat or a post, the link shows this picture. If you use the figures, please say "Source: Open Hastings" and name DEFRA.