From HM Land Registry
House prices in Hastings
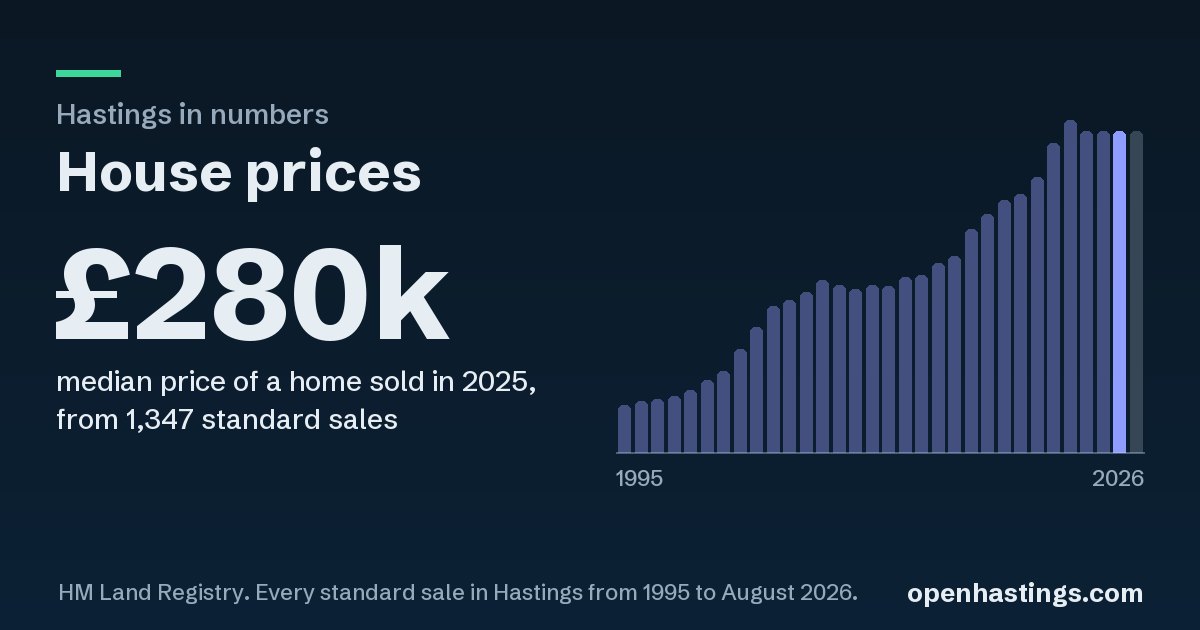
£280k
median price of a home sold in 2025, from 1,347 standard sales.
The figures as a table
| Year | Median price | Sales |
|---|---|---|
| 1995 | £41k | 1,676 |
| 1996 | £44k | 2,030 |
| 1997 | £46k | 2,374 |
| 1998 | £49k | 2,340 |
| 1999 | £54k | 2,637 |
| 2000 | £62k | 2,593 |
| 2001 | £71k | 3,088 |
| 2002 | £90k | 3,365 |
| 2003 | £109k | 2,663 |
| 2004 | £128k | 2,649 |
| 2005 | £133k | 2,337 |
| 2006 | £140k | 2,782 |
| 2007 | £150k | 2,852 |
| 2008 | £146k | 1,377 |
| 2009 | £142k | 1,210 |
| 2010 | £146k | 1,142 |
| 2011 | £145k | 1,281 |
| 2012 | £153k | 1,197 |
| 2013 | £155k | 1,542 |
| 2014 | £165k | 1,901 |
| 2015 | £171k | 1,953 |
| 2016 | £195k | 1,906 |
| 2017 | £208k | 1,869 |
| 2018 | £220k | 1,698 |
| 2019 | £225k | 1,493 |
| 2020 | £240k | 1,346 |
| 2021 | £270k | 2,064 |
| 2022 | £290k | 1,672 |
| 2023 | £280k | 1,274 |
| 2024 | £280k | 1,311 |
| 2025 | £280k | 1,347 |
| 2026 | £280k | 554 |
What it counts
The middle price of the homes sold each year: half sold for more, half for less. It moves with the mix of homes sold as well as with prices. Standard sales only: repossessions, buy-to-let purchases with a mortgage and sales to companies aren't included.
Where it comes from
- From
- HM Land Registry, Price Paid Data
- Period
- Every standard sale in Hastings from 1995 to August 2026. 2026 is part of a year, so it's drawn lighter.
- Licence
- Contains HM Land Registry data © Crown copyright and database right 2026. This data is licensed under the Open Government Licence v3.0.
- Read
- 12 October 2026
Share it
Shared in a chat or a post, the link shows this picture. If you use the figures, please say "Source: Open Hastings" and name HM Land Registry.