From DEFRA
Recycling in Hastings
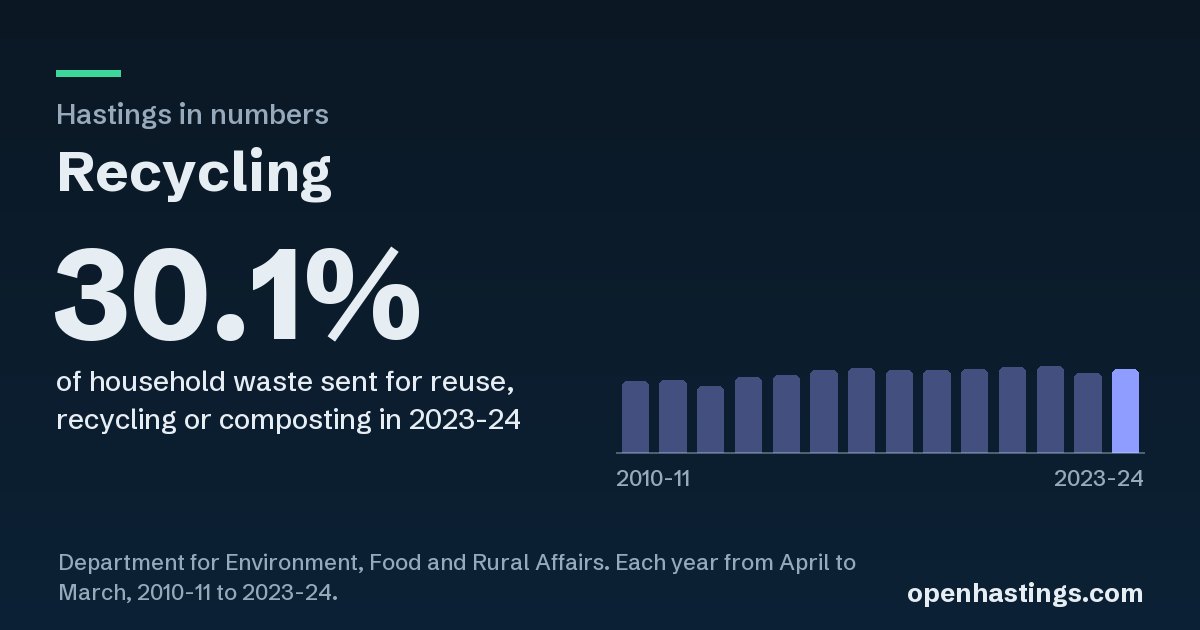
30.1%
of household waste sent for reuse, recycling or composting in 2023-24.
The figures as a table
| Year (April to March) | Share recycled |
|---|---|
| 2010-11 | 25.7% |
| 2011-12 | 25.9% |
| 2012-13 | 23.7% |
| 2013-14 | 27.1% |
| 2014-15 | 28% |
| 2015-16 | 29.6% |
| 2016-17 | 30.3% |
| 2017-18 | 29.6% |
| 2018-19 | 29.5% |
| 2019-20 | 29.9% |
| 2020-21 | 30.8% |
| 2021-22 | 31.2% |
| 2022-23 | 28.6% |
| 2023-24 | 30.1% |
What it counts
The share of the household waste the borough collects that goes to be reused, recycled or composted, by weight.
Where it comes from
- From
- Department for Environment, Food and Rural Affairs, ENV18 - Local authority collected waste: annual results tables (Historical)
- Period
- Each year from April to March, 2010-11 to 2023-24.
- Licence
- Open Government Licence v3.0.
- Read
- 12 October 2026
Share it
Shared in a chat or a post, the link shows this picture. If you use the figures, please say "Source: Open Hastings" and name DEFRA.